Monitor your WEB server
This guide cover the creation of a service to monitor your WEB site. It can be used as a reference to create other services. Only the service parameters are specific, all other tasks are similar.
You are supposed to have an account and have already created a domain. If not, look here to create your account.
Create a new service
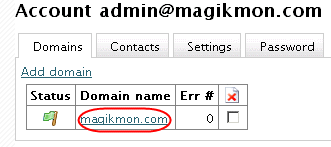
After you have logged in, select the domain that will own the monitoring service.
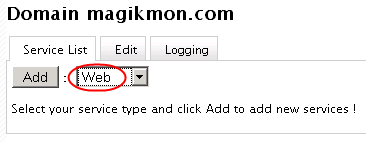
Select Web and click the Add button.
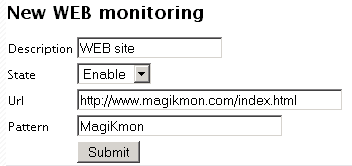
Give a description for your service, specify the URL of the page you want
to monitor, and a pattern MagiKmon will find in your page. This is to be sure
the page displays the expected content. You can choose a word or even a sentence, but
be careful to take care of the HTML markup.
Click the Submit button to create the service.
Service
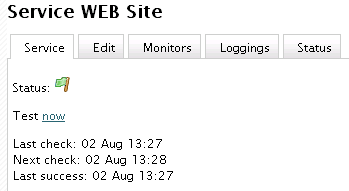
The new service will check your WEB server every 5min and detect any status change.
You can force a check by clicking the Test now link.
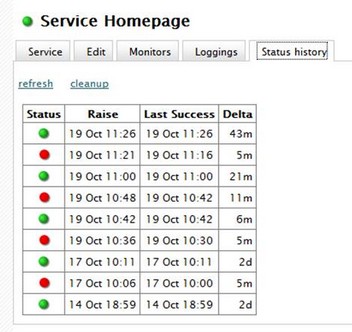
Any status modification will be recorded and shown in the Status history tab.
Here the service started (at the bottom) the 14 October in good health. 2 days later
the service become unreachable the 17 October at 10H00 and an alert was raised
at 10H06. 5m later the service become up again and one alert
was raised immediately. A success is always notified immediately, a failure
as to wait for the grace period ! This has evolved up to now the 19 October
at 11H26 where the service switched to up and is up for 43m, now
it is 12H09.
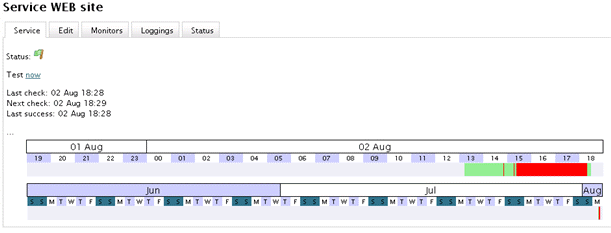
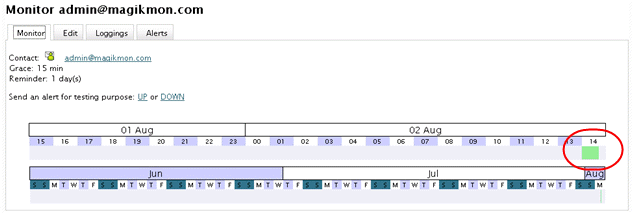
A more graphical view can be seen on the time line available on the first tab
This show the evolution of the status for the last 24H period. (the first time line)
and for the last two month (the second one).
Add a monitor
 To be warned when something change, you need to create a monitor.
A monitor is in charge of detecting a status change and send an alert to a contact.
To be warned when something change, you need to create a monitor.
A monitor is in charge of detecting a status change and send an alert to a contact.
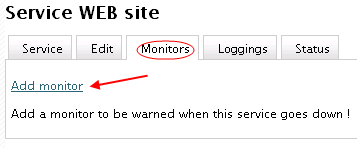
To create a new monitor, go to the Monitors panel and click the
Add monitor.
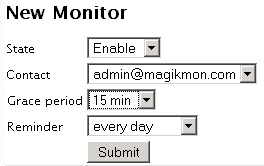 Let the state to Enable.
Choose a contact. A contact can be an email address, a SMS number or an URL. New contact can be added
at the account level.
To avoid untimely alert, choose an appropriate grace period. No alert will be generated
if the failure is shorter than the grace period.
You can be remembered at regular interval if wanted.
When done click the Submit button to create your monitor.
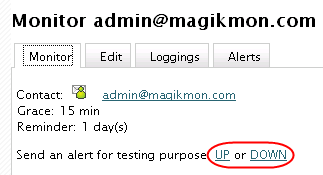
When created, you can test your monitor by sending a test alert using the
UP or the DOWN link.
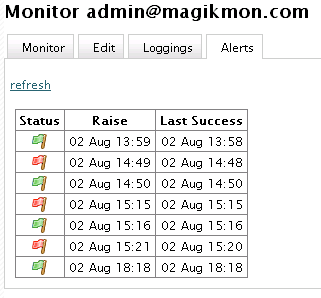
Any failure longer than the grace period will raise an alerts.
All previous alerts can be seen in the Alerts panel.
Or visualised on the time line.
Failure shorter than the grace period will not generate
any alert and then not be visible on the time line.
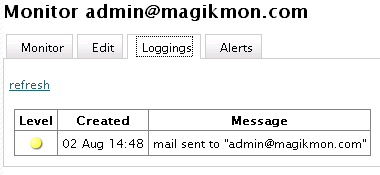
The loggings tab collect relevant information about the monitor like a failure when
sending an alert. This is the place to look at if you are not receiving an alert.
More
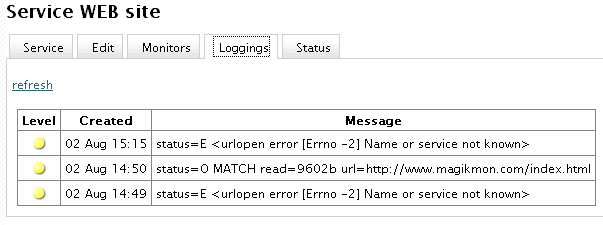
As for monitor, the loggings tab can hold interesting information about
success or failure of the service.
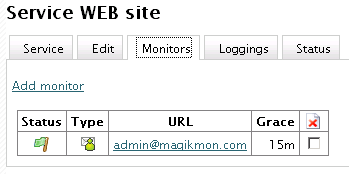
To see the list of monitors, select the monitors tab.
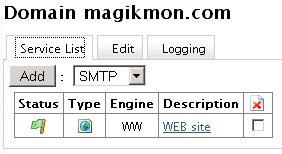
The list of services can bee seen in the Service List tab at the domain level.
Go back to the Getting started section to create more services !